Advanced Analytics & Data Dashboards
Data without insights and actionability is junk. We built an analytics engine, that will enable to dig deep, tell a story and drive action.

Data without insights and actionability is junk. We built an analytics engine, that will enable to dig deep, tell a story and drive action.
formsflow.ai’s analytics engine allows users to visualize form and associated data from diverse data sources using fully customizable dashboards. You can track submission metrics and derive insights from the submitted form data.
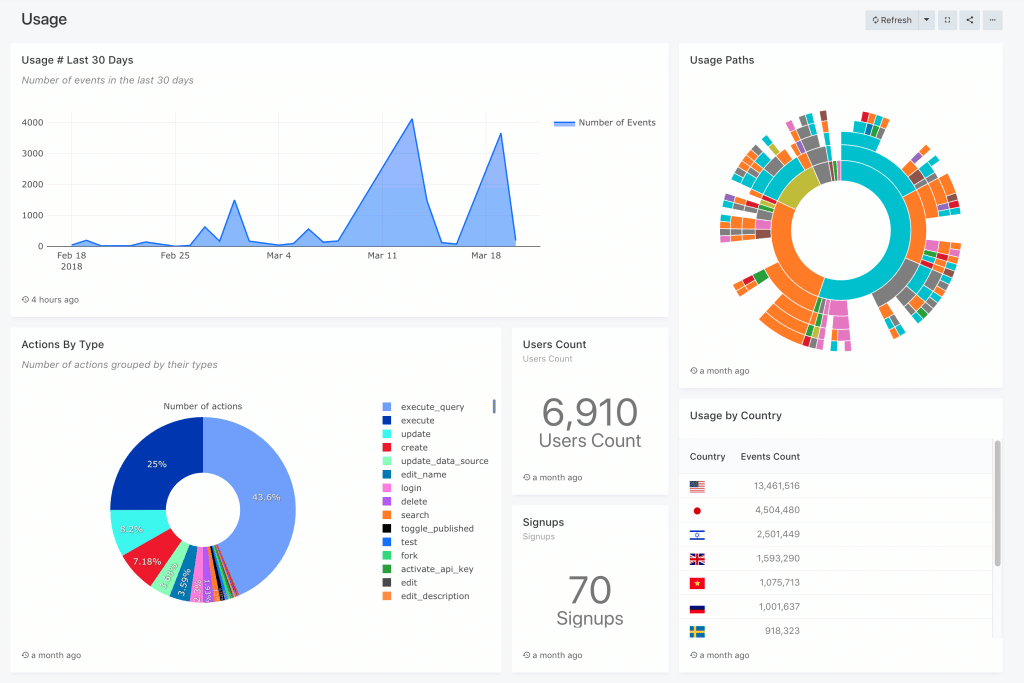
Admin users of formsflow.ai can configure dashboards to display qualitative and quantitative insights from form submissions. This allows a formsflow.ai user to set the definitions of what data will be displayed and how, in order to better understand the information they receive and make decisions. These interactive dashboards can save time by providing the requisite information at a glance.
If you have some knowledge of SQL, you can unlock the full potential.
We support 10 types of visualizations:
Let us show you more. Talk to us.